


.png)
Agenda
- Execution Modes
- Production Mode
- Debug Mode
- Enable Debug Mode
- Use Chrome DevTools
- Debug with LWS Enabled
Lightning web components are built using standard HTML and JavaScript, and on the desktop they run in a variety of supported browsers. You can use standard browser and JavaScript debugging tools, like Chrome DevTools, to debug your components during development.
The simplest way to run and debug a component during development is to create a Lightning Page and add your component to it. Then load the Lightning Page in your preferred browser and use your favorite inspection and debugging tools. LWC debugging is optimized for Chrome DevTools.
Production Mode
By default, the framework runs in production mode. This mode is optimized for performance.
In production mode, JavaScript code is optimized and “minified” to reduce the size of the code to as few bytes as possible. Production mode removes line breaks, spaces, tabs, and code comments, and shortens the names of functions and variables.
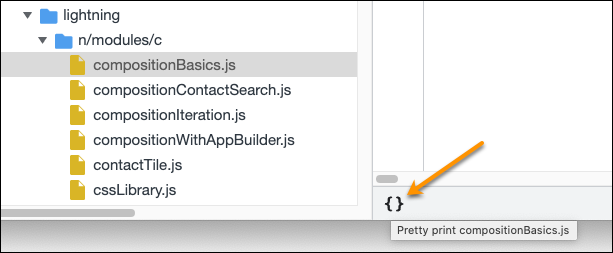
You can use the “pretty print” option in Chrome DevTools to get minimal code formatting in production mode. Click the {} pretty print icon at the bottom of the Sources panel to open a new tab with formatting applied.
Here is a sample of what you will see in production mode without pretty print option vs with pretty print option.

Debug Mode
In debug mode, JavaScript code is easier to read and debug. The JavaScript source you see in DevTools looks similar to your uncompiled source code. Debug mode also adds more detailed output for some warnings and errors.
After your user account is enabled for debug mode, you see these changes.
- A banner appears at the top to remind you that debug mode is on and that it slows things down.
- An Experienced Page Time (EPT) metric appears in the page header. It’s presented in green, orange, or red to indicate the health of the page’s load time.
- A storage metric in the page header shows kilobytes of data stored by the page to indicate memory usage and caching. The metric is similarly color-coded with green, orange, or red.

The same lwc-recipes sample code we looked at in production mode with pretty print looks less cryptic when unminified with debug mode enabled. It’s more readable and shows names of functions and variables.
Enable Debug Mode
- In Salesforce, from Setup, enter Debug Mode in the Quick Find box, then select Debug Mode Users.
- Users with debug mode enabled have a check mark in the Debug Mode column.
- In the user list, locate any users who need debug mode enabled. If necessary, use the standard list view controls to filter your org’s users.
- Select the checkbox next to users for whom you want to enable debug mode.
- Click Enable.
Tips
- If you see only a few lines of code in a JavaScript file, then debug mode is not enabled. If enabling debug mode doesn’t reset the code in the code editor, do a hard reload. With DevTools open, right-click the browser Reload button and then click Hard Reload.
- Only enable debug mode for users who are actively debugging JavaScript. Salesforce is slower for users who have debug mode enabled.
Use Chrome Dev Tools
Google Chrome includes a comprehensive suite of excellent web development tools, Chrome DevTools. These tools are great for debugging your Lightning web components.
To get started, load the simplest page possible that can run your Lightning component. Then open DevTools.
- On Windows and Linux, press Control-Shift-I in your Google Chrome browser.
- On Mac, press Option-Command-I.
- On any platform, press F12 or right-click in the page and select Inspect.
- To quickly find which line of code is failing, in the Sources panel, enable the Pause on all exceptions option in the DevTools debugger panel before running your code.

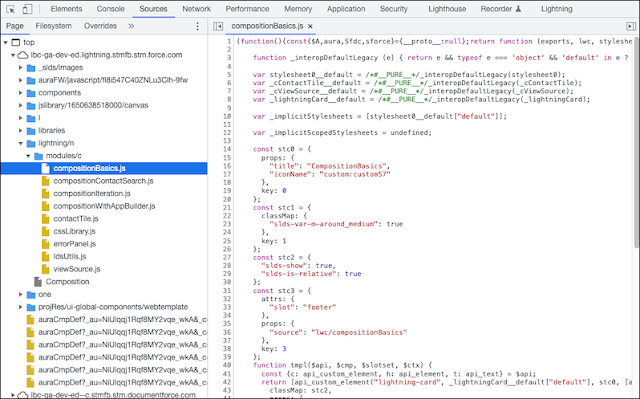
In the Sources panel of Chrome DevTools, find your Lightning web component code in the Page pane in the lightning/n/modules folder. Here you see components in the default c namespace folder.

Debugging techniques are the same for code compiled for LWS, but let’s walk through a few differences.


Checkout the Crash Course Below

If you have any question please leave a comment below.
If you would like to add something to this post please leave a comment below.
Share this blog with your friends if you find it helpful somehow !
Thanks
Happy Coding :)


.png&description=#9: Debug Lightning Web Components | Learn Lightning Web Component Development | LWC Stack Salesforce)
0 Comments