


A sankey diagram is a visualization used to depict a flow from one set of values to another. The things being connected are called nodes and the connections are called links. Sankeys are best used when you want to show a many-to-many mapping between two domains (e.g., universities and majors) or multiple paths through a set of stages (for instance, Google Analytics uses sankeys to show how traffic flows from pages to other pages on your web site).
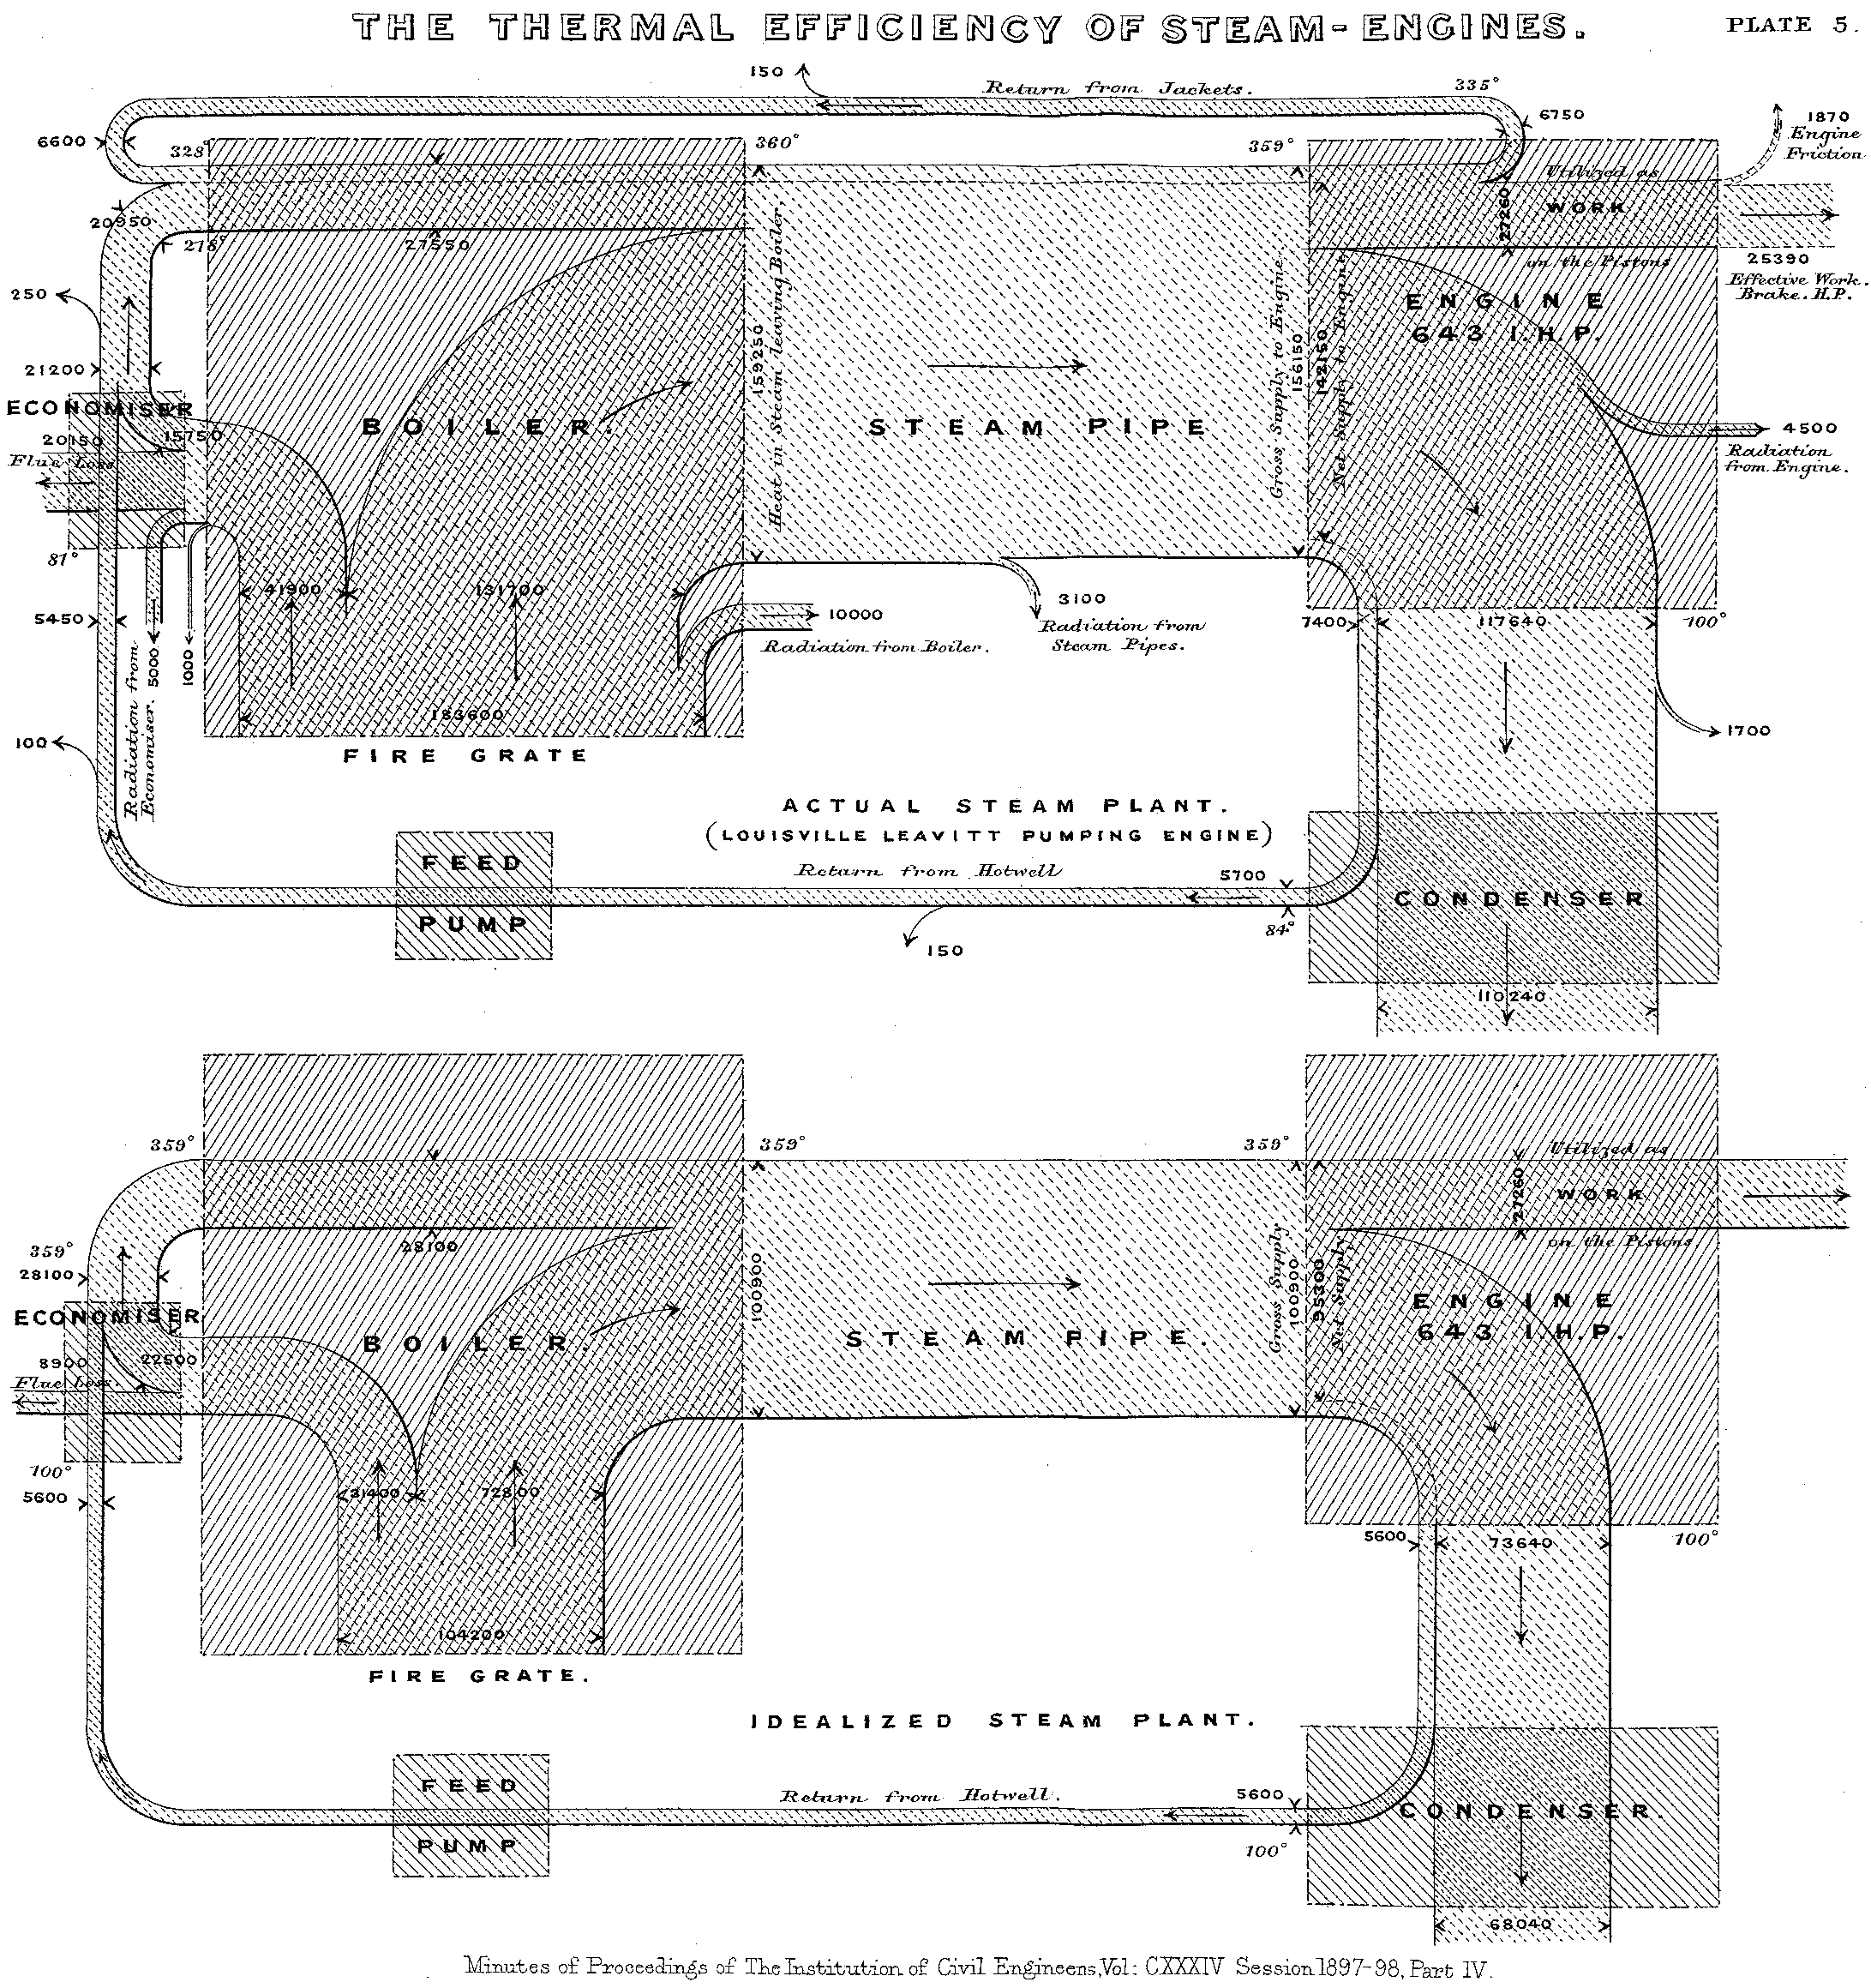
For the curious, they're named after Captain Sankey, who created a diagram of steam engine efficiency that used arrows having widths proportional to heat loss.
Example
Suppose you had two categories, A and B, that connect to three other categories, X, Y, and Z. Some of those connections are heavier than others. For instance, B has a thin connection to X and a much thicker connection to Y.

Visualforce Page
1 2 3 4 5 6 7 8 9 10 11 12 13 14 15 16 17 18 19 20 21 22 23 24 25 26 27 28 29 30 31 32 33 34 35 36 37 38 39 40 41 42 43 44 45 46 47 48 49 50 51 52 53 54 55 56 57 58 59 60 61 62 | <apex:page controller="Vlog_SankeyDiagramCtrl" > <apex:form > <html> <head> <script type="text/javascript" src="https://www.gstatic.com/charts/loader.js"></script> <script type="text/javascript"> google.charts.load('current', {'packages':['sankey']}); google.charts.setOnLoadCallback(drawChart); var Name = '{!Name}'; Name = Name.replace("[",""); Name = Name.replace("]",""); var NameArr=Name.split(','); var BookName = '{!BookName}'; BookName = BookName.replace("[",""); BookName = BookName.replace("]",""); var BookNameArr=BookName.split(','); var Quantity = '{!Quantity}'; Quantity = Quantity.replace("[",""); Quantity = Quantity.replace("]",""); // Quantity = Quantity.replace(".0",""); var QuantityArr=Quantity.split(','); function drawChart() { var data = new google.visualization.DataTable(); data.addColumn('string', 'From'); data.addColumn('string', 'To'); data.addColumn('number', 'Quantity'); for (var i = 0; i < NameArr.length; i++) { console.log('###Type : '+NameArr[i].trim()+','+BookNameArr[i].trim()+','+QuantityArr[i].trim()); data.addRow([NameArr[i].trim(),BookNameArr[i].trim(),parseInt(QuantityArr[i].trim())]); } /* data.addRows([ [ 'A', 'X', 5 ], [ 'A', 'Y', 7 ], [ 'A', 'Z', 6 ], [ 'B', 'X', 2 ], [ 'B', 'Y', 9 ], [ 'B', 'Z', 4 ] ]); */ // Sets chart options. var options = { width: 600, }; // Instantiates and draws our chart, passing in some options. var chart = new google.visualization.Sankey(document.getElementById('sankey_basic')); chart.draw(data, options); } </script> </head> <body> <div id="sankey_basic" style="width: 900px; height: 300px;"></div> </body> </html> </apex:form> </apex:page> |
Apex
1 2 3 4 5 6 7 8 9 10 11 12 13 14 15 16 17 18 19 20 21 | public class Vlog_SankeyDiagramCtrl { public List<Global_Libraries__c> glList{get;set;} public List<String> Name{get;set;} public List<String> BookName{get;set;} public List<Double> Quantity{get;set;} public Vlog_SankeyDiagramCtrl(){ Name = new List<String>(); BookName = new List<String>(); Quantity = new List<Double>(); glList = [SELECT Name, Book_Name__c, Quantity__c FROM Global_Libraries__c ]; for(Global_Libraries__c gl : glList){ Name.add(gl.Name); BookName.add(gl.Book_Name__c); Quantity.add(gl.Quantity__c); } } } |
Checkout complete tutorial below


0 Comments